A big 18 month project at work culminated today in the release of new Monthly Regional Tourism Estimates for New Zealand. Great work by the team in an area where we’ve pioneered the way, using administrative data from electronic transactions to supplement traditional sources in producing official statistics.
Here’s a screen shot from one of the pages letting people play with the data:
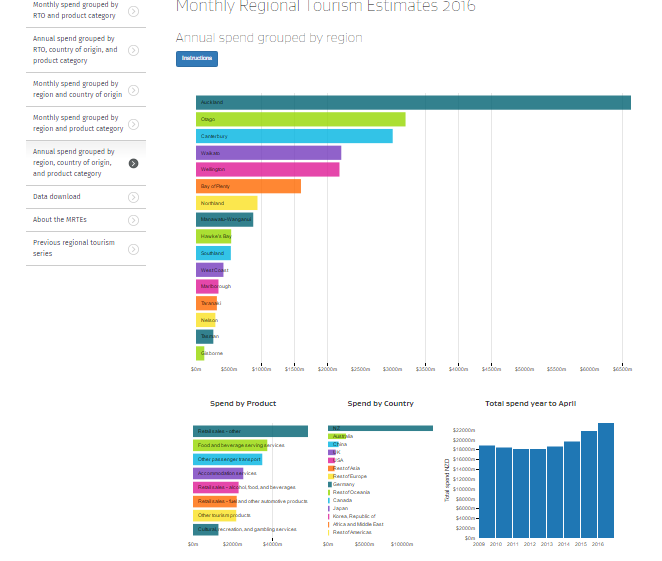
The source data include electronic card spend, survey data, and the National Accounts. All the data production is done in R, with iterative proportional fitting, smoothing, time series forecasts, and yet more iterative proportional fitting before we come up with the best available estimates of how much is spent by tourists by product by origin by time period. This project builds on a range of developments we’ve made since 2012 with previous Regional Tourism Indicators and annual Regional Tourism Estimates. The data will be updated every month from now on.
A collection of web pages with interactive graphics help users explore the data, all of which can also be downloaded for re-use.
The interactive graphics are hand coded in JavaScript, with R used for all the pre-processing (eg reshaping, tidying, calculating moving averages, etc).
Great work, team at work!