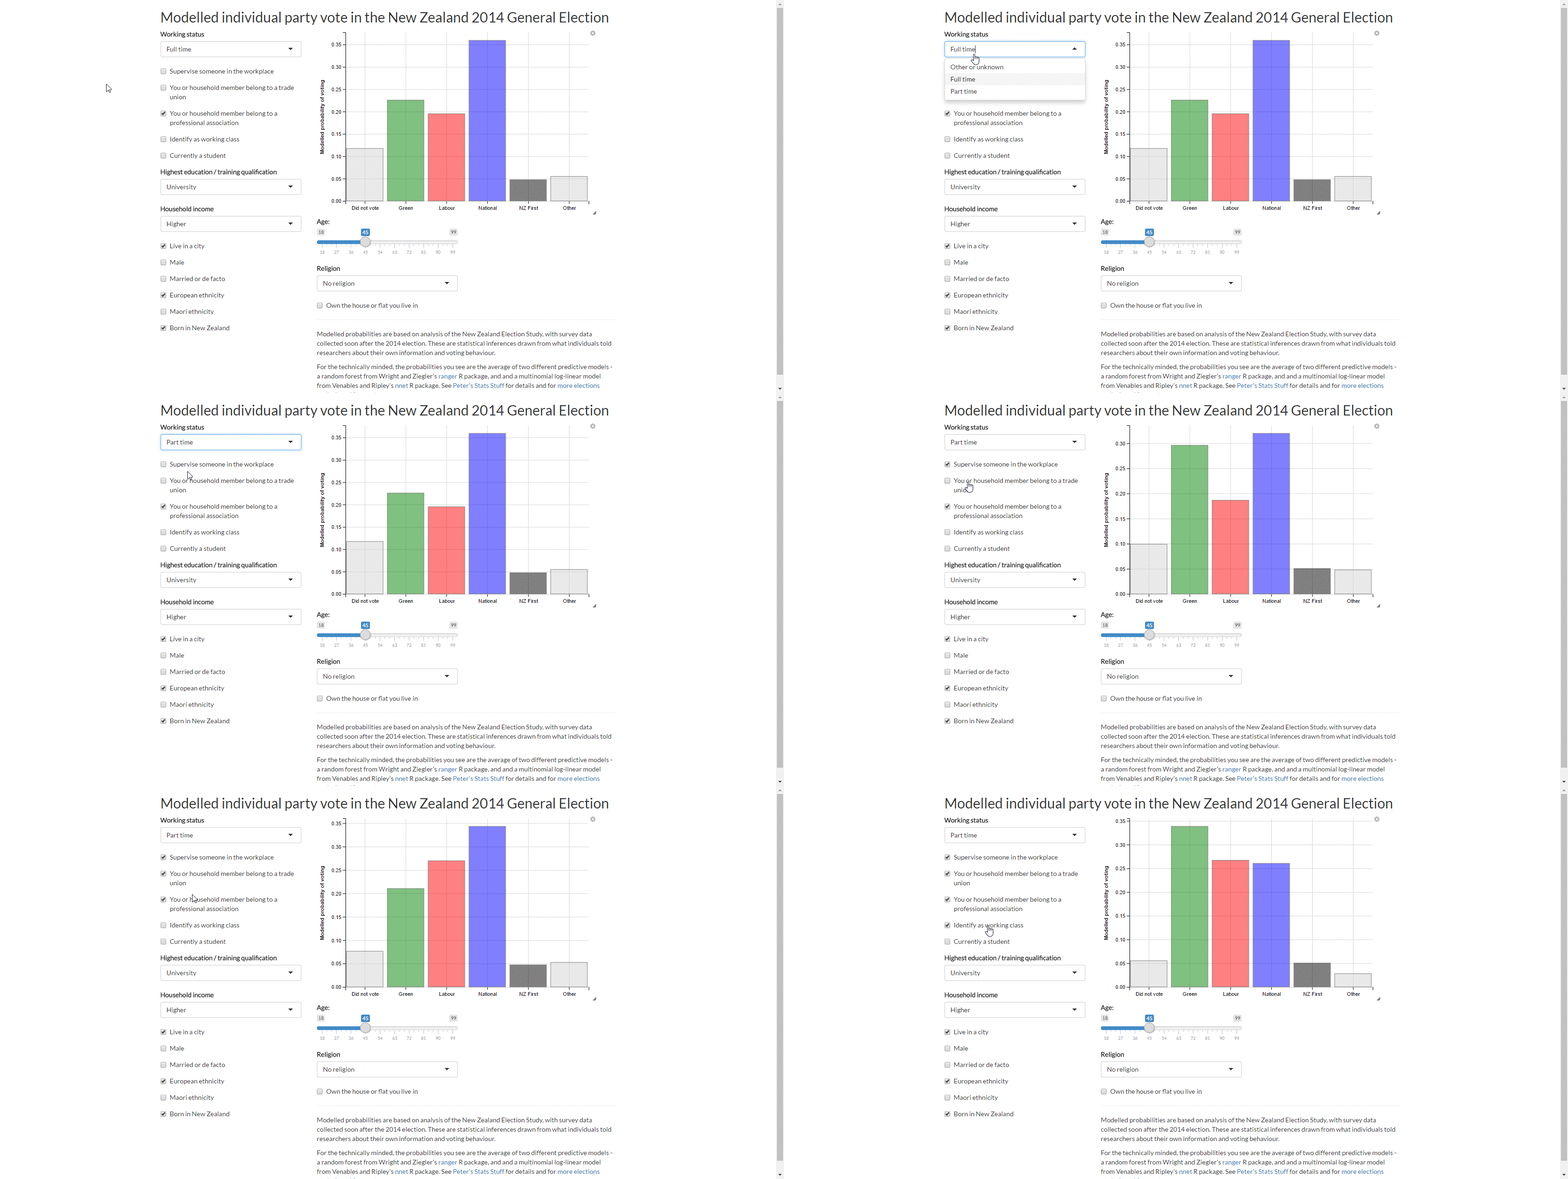
Last week I posted some analysis of individual voting behaviour in New Zealand’s 2014 general election. In that post, I used logistic regression in four different models to predict the probability of an individual giving party vote to each of the four largest parties - National, Labour, Green and New Zealand First. That let the user compare the people voting for each of those parties, one at a time, to the wider population.
A logical extension of this is to model party vote for those four categories, plus “other” and “did not vote”, simultaneously as a multinomial response. I tried this out with several different methods: a deep learning neural network (from H2O, random forest (trying out both the H2O version and ranger, a fast R/C++ implementation), and multinomial log-linear regression (from nnet). The aim was to produce an interactive web tool that lets people see the impact of changing one variable at a time on predicted voting probabilities:
As per last week’s approach, I use about 20 explanatory variables in total with 2,835 observations. As my purpose was predictive analytics rather than structural inference, I dealt with the survey weighting by the brute force method of creating replicates of each row with the number of rows proportionate to their calibrated survey weight (on average 10 rows each). I added some noise to the data (as extra missing values for one variable per person) in the interest of regularising the predicted probabilities and used a variant of multiple imputation to deal with the missing data.
After playing around with tuning via the very convenient h2o.grid function, the best performing model was the neural network with two hidden layers of 60 neurons each and a high dropout rate between each layer. However, this was a bit slow for the end user when implemented in Shiny for the web app, and I anticipated some further problems in deploying an H2O model to shinyapps.io - problems I’ll address at some point, but not today. So in the end I used an average of the ranger random forest and the nnet::multinom multinomial regression models, which is nice and fast and gives very plausible results.
See:
- The web tool itself;
- Source code for the preparation for the Shiny app (I always separate out as much prep as possible from a Shiny app deployment, for ease of maintenance as well as faster user experience) and the various experiments in different models;
- Source code for the app itself.
As usual, comments, suggestions and corrections are welcomed.
